Temperature API Parameters
Temperature (immediate) | Interval Values of Temperature | Mean Temperature over the Last 10 Years | Temperature AnomaliesTemperature (immediate)
Gives the instantaneous temperature at the indicated level above ground or pressure level in the corresponding unit. Standard height for surface air temperature is 2m.
t_<level>:<unit>Available levels (global): -300cm, -160cm, -150cm, -100cm, -60cm, -50cm, -30cm, -15cm, -10cm, -5cm, -4cm, -1cm, 0cm, 0m, 5cm, 2m - 20000m (continuously), 1000hPa, 975hPa, 950hPa, 925hPa, 900hPa, 875hPa, 850hPa, 825hPa, 800hPa, 775hPa, 750hPa, 700hPa, 650hPa, 600hPa, 550hPa, 500hPa, 450hPa, 400hPa, 350hPa, 300hPa, 250hPa, 200hPa, 150hPa, 100hPa, 70hPa, 50hPa, 10hPa
Available flight levels: FL10 - FL900 (continuously)
Available units: C, K, F
Examples
-
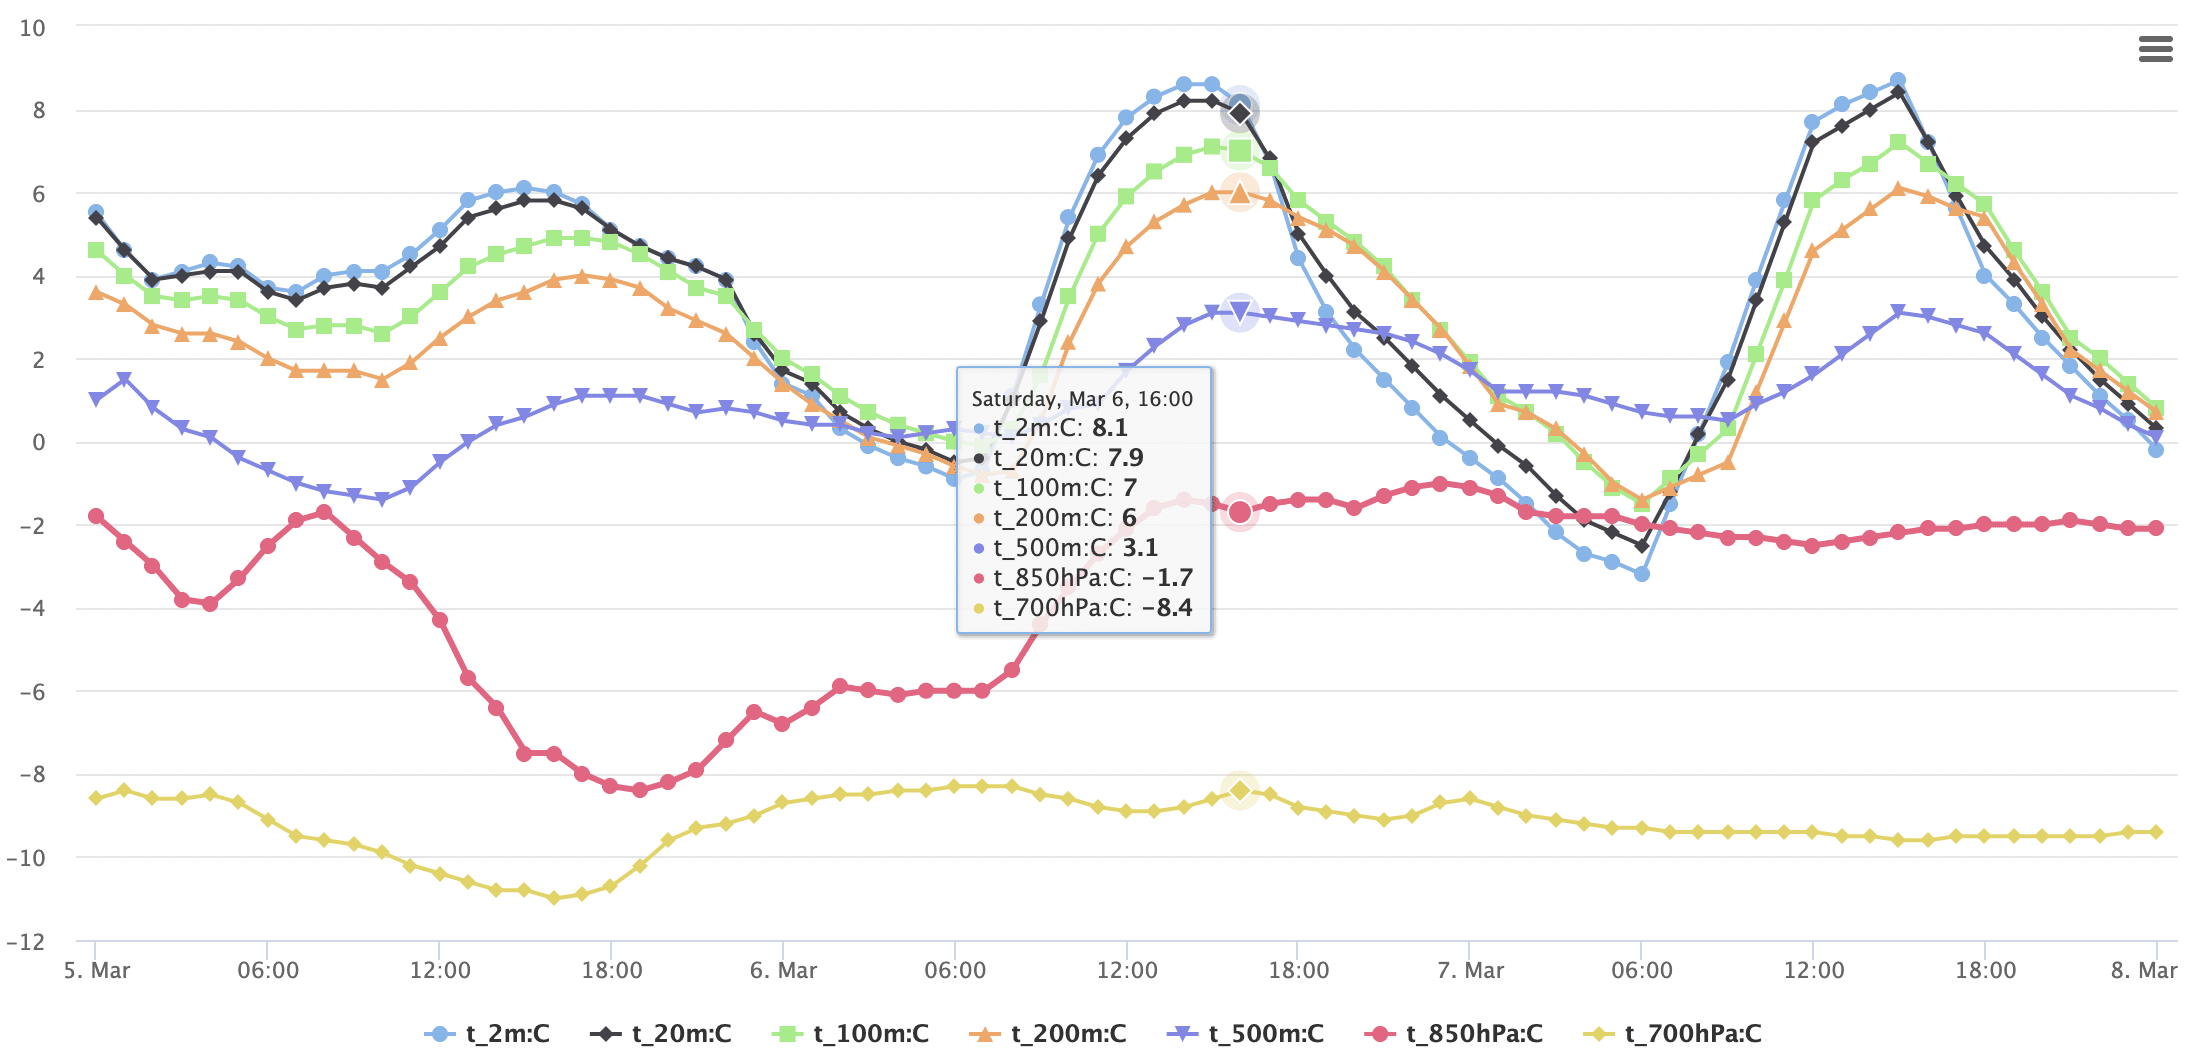
Create a time series of temperature values in °C at different altitudes for Paris:
https://api.meteomatics.com/2026-03-30T00:00:00Z--2026-04-02T00:00:00Z:PT1H/t_2m:C,t_20m:C,t_100m:C,t_200m:C,t_500m:C,t_850hPa:C,t_700hPa:C/48.8566,2.3522/html -
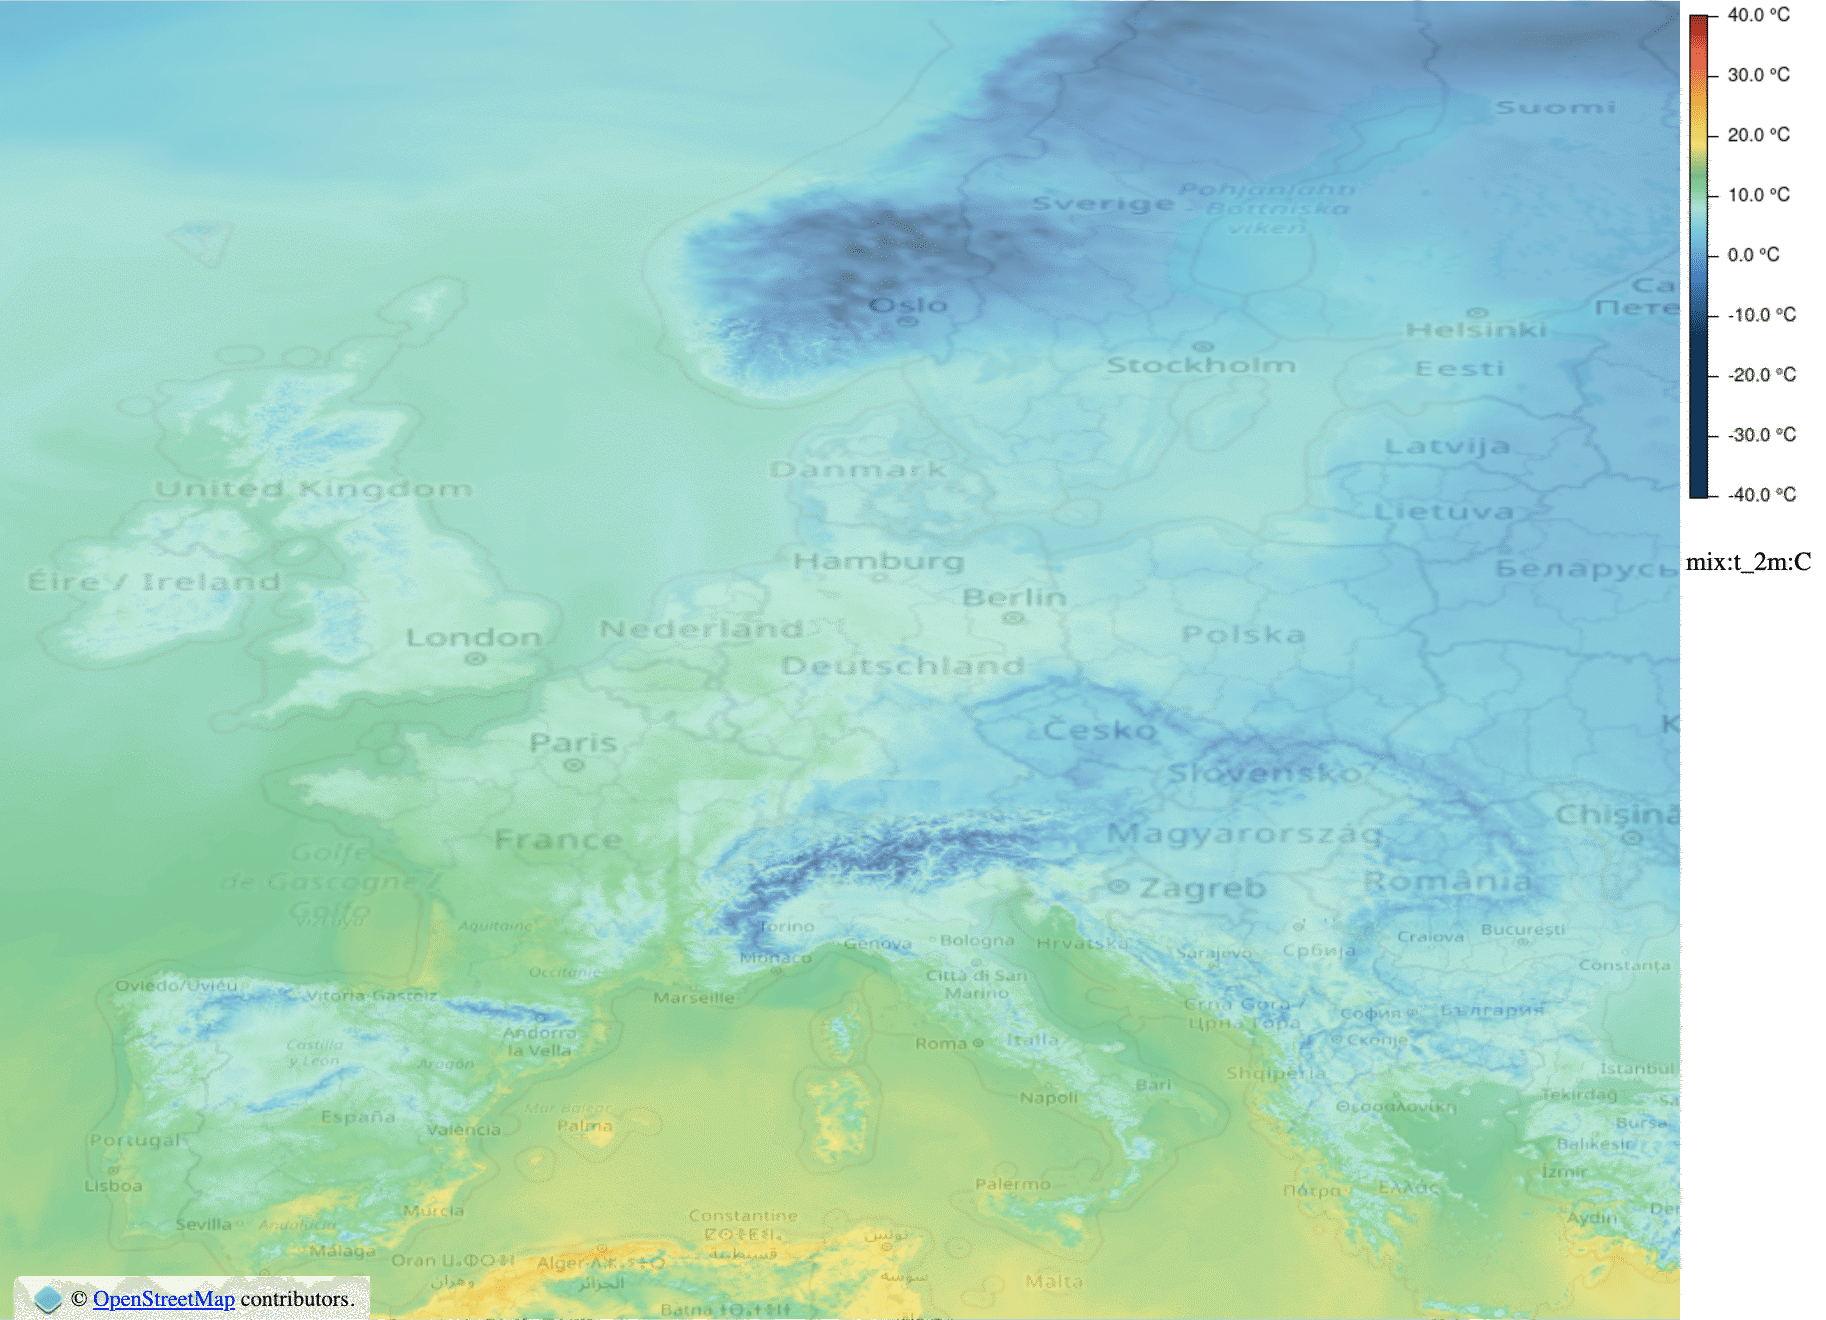
Show an HTML map:
https://api.meteomatics.com/now/t_2m:C/europe:0.05,0.05/html_map Here is an example for the JSON format:
https://api.meteomatics.com/2026-03-30T00:00:00Z--2026-04-02T00:00:00Z:PT1H/t_2m:C/48.8566,2.3522/json{"version":"3.0","user":"api-test","dateGenerated":"2017-08-25T08:19:07Z","status":"OK","data": [{"parameter":"t_2m:C","coordinates":[{"lat":47.4122,"lon":9.34065,"dates": [{"date":"2017-08-25T00:00:00Z","value":15.6},{"date":"2017-08-25T03:00:00Z","value":15.1}, {"date":"2017-08-25T06:00:00Z","value":18.8},{"date":"2017-08-25T09:00:00Z","value":23.8}, {"date":"2017-08-25T12:00:00Z","value":25.2},{"date":"2017-08-25T15:00:00Z","value":25.1}, {"date":"2017-08-25T18:00:00Z","value":21.8},{"date":"2017-08-25T21:00:00Z","value":19.6}, {"date":"2017-08-26T00:00:00Z","value":19.4}]}]}]}


Interval Values of Temperature
Gives the mean, maximum or minimum temperature at the indicated level over the indicated duration. Standard height for surface air temperature is 2m.
t_<measure>_<level>_<interval>:<unit>Available levels (global): -300cm, -160cm, -150cm, -100cm, -60cm, -50cm, -30cm, -15cm, -10cm, -5cm, -4cm, -1cm, 0cm, 0m, 5cm, 2m - 20000m (continuously), 1000hPa, 975hPa, 950hPa, 925hPa, 900hPa, 875hPa, 850hPa, 825hPa, 800hPa, 775hPa, 750hPa, 700hPa, 650hPa, 600hPa, 550hPa, 500hPa, 450hPa, 400hPa, 350hPa, 300hPa, 250hPa, 200hPa, 150hPa, 100hPa, 70hPa, 50hPa, 10hPa
Available flight levels: FL10 - FL900 (continuously)
Available measures: mean, min, max
Available intervals: 5min, 10min, 15min, 20min, 30min, 1h - 24h (spacing: 1 h)
Available units: C, K, F
Examples
-
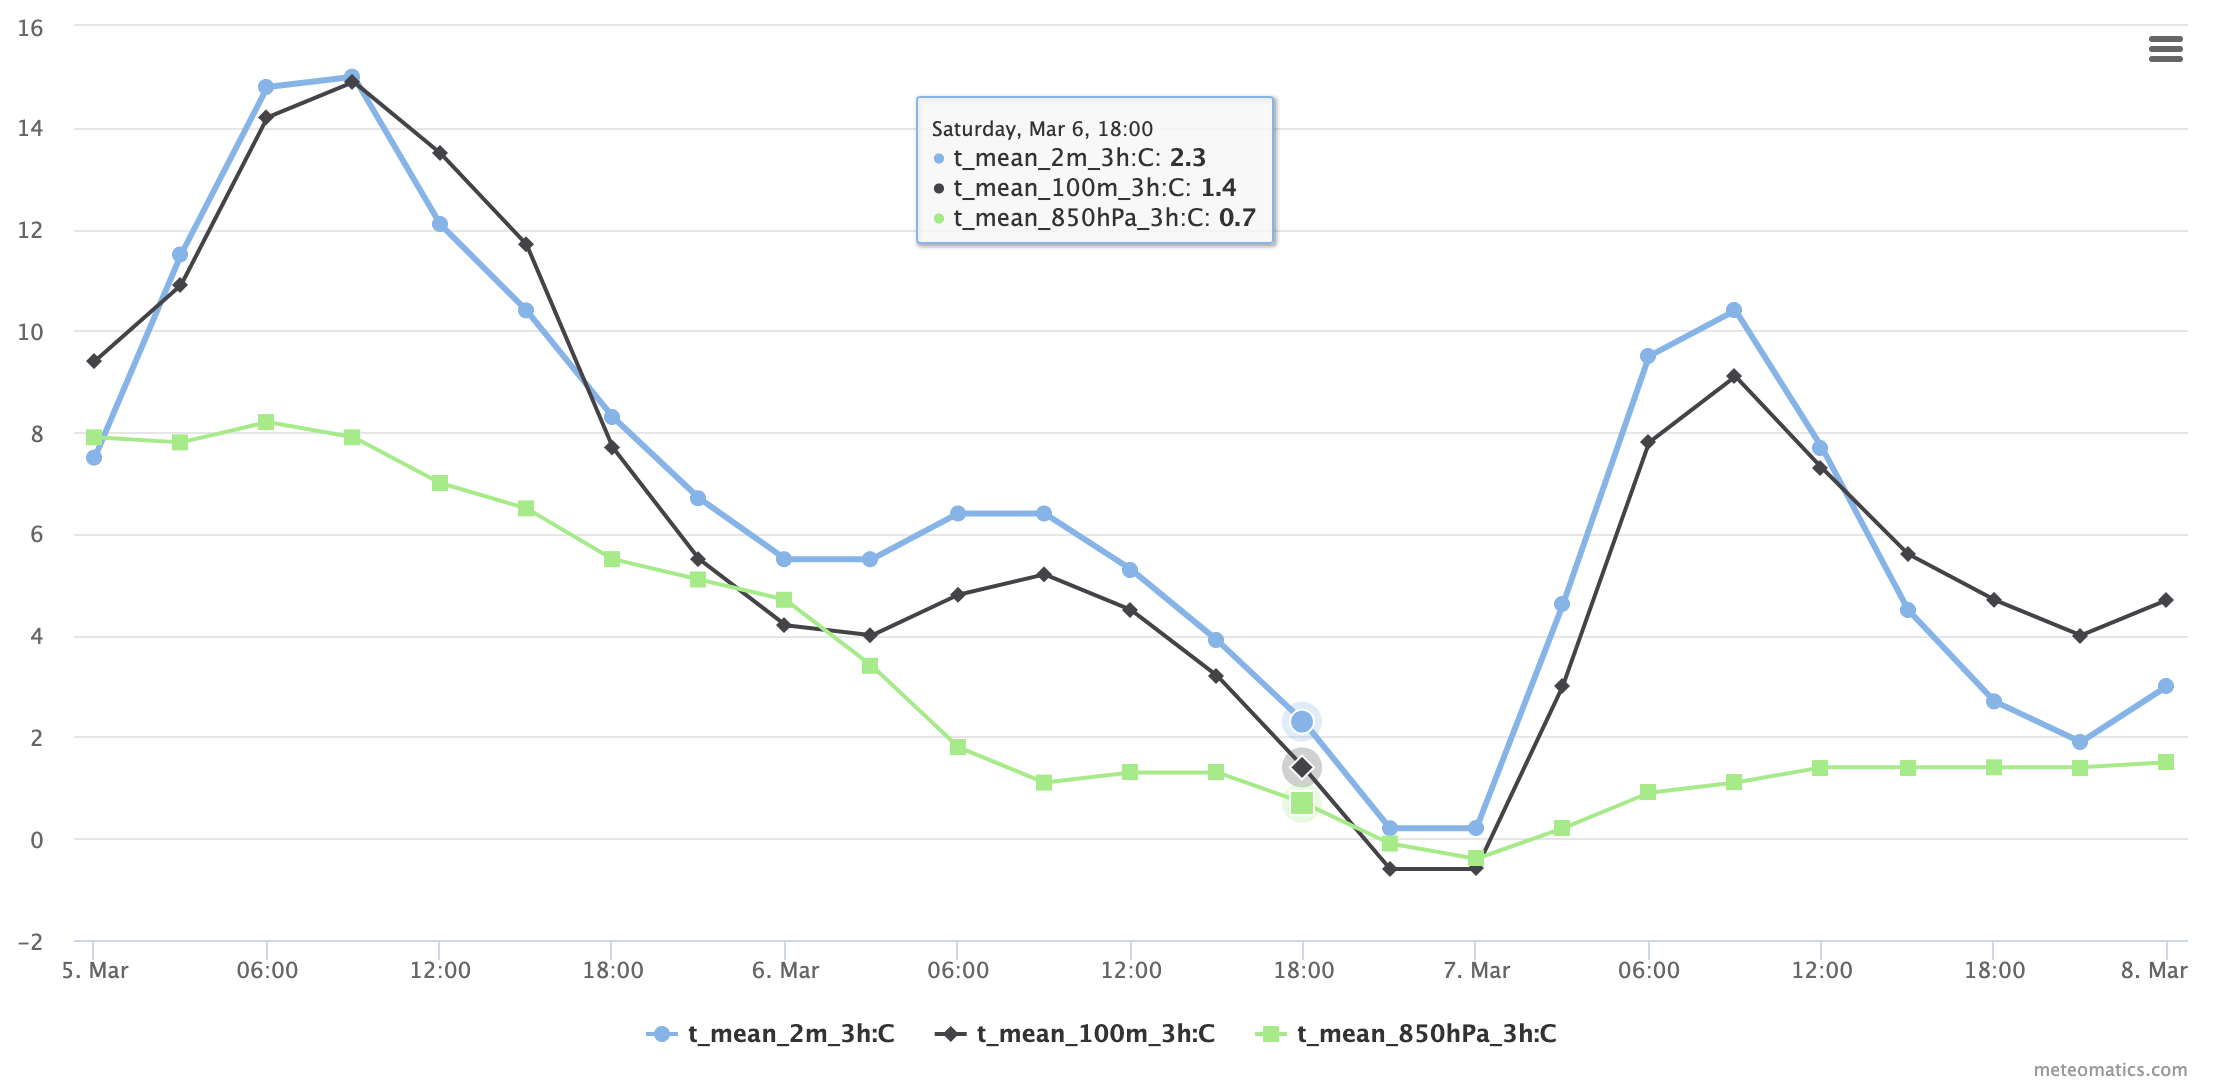
Create a time series for the mean temperature in °C at different heights for Los Angeles using 3 hour intervals.
https://api.meteomatics.com/2026-03-30T00:00:00Z--2026-04-02T00:00:00Z:PT3H/t_mean_2m_3h:C,t_mean_100m_3h:C,t_mean_850hPa_3h:C/34.0522,118.2437/html -
validdate;t_mean_2m_3h:C
2018-02-05T00:00:00Z;-1.7
2018-02-05T03:00:00Z;-2.1
2018-02-05T06:00:00Z;-2.7
2018-02-05T09:00:00Z;-2.9
2018-02-05T12:00:00Z;-0.9
2018-02-05T15:00:00Z;0.5
2018-02-05T18:00:00Z;-0.8
2018-02-05T21:00:00Z;-2
2018-02-06T00:00:00Z;-3.1

Mean Temperature over the Last 10 Years
Gives the mean 2m-temperature over the last 10 years on a certain date at a specific location.
t_2m_10y_mean:<unit>Available units: K, C, F
Examples:
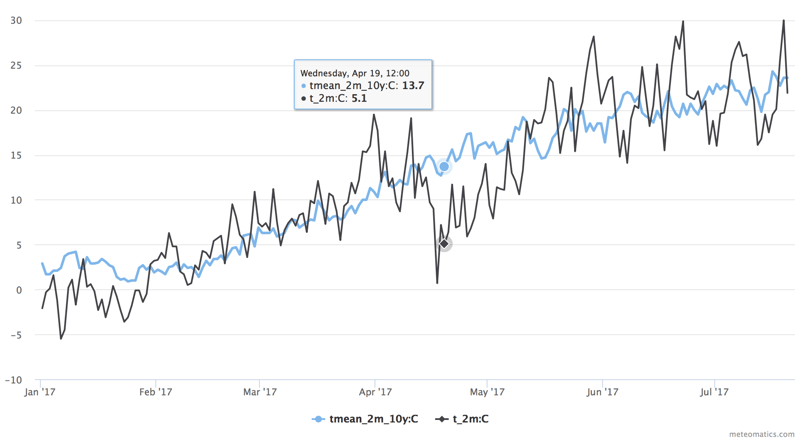
- Compare the mean temperature of the last ten years with the temperatures of 2017.
Current situation:
https://api.meteomatics.com/2023-06-06T12:00:00ZP100D:P2D/t_2m_10y_mean:C,t_2m:C/50,10/html - The temperature in winter compared to the 10-years mean:
validdate;t_2m_10y_mean:C;t_2m:C
2016-10-01T12:00:00Z;16.1;15.9
2016-11-01T12:00:00Z;10.7;6.9
2016-12-01T12:00:00Z;4;2.3
2017-01-01T12:00:00Z;2.9;-2.1
2017-02-01T12:00:00Z;2.2;3.2
Current situation:
https://api.meteomatics.com/2023-06-06T12:00:00ZP4M:P1M/t_2m_10y_mean:C,t_2m:C/50,10/csv
Temperature Anomalies
Shows the deviation of mean, maximum, or minimum temperatures over the past 24 hours from the selected Date/Time, compared to the same 24-hour period in the 30-year climatological reference period (1991–2020).
anomaly_t_<measure>_2m_24h:<unit>Available measures: mean, min, max
Available units: C, K, F
Examples
-
Map of temperature anomalies across Europe for the current time, showing deviations from the climatological norm.
https://api.meteomatics.com/now/anomaly_t_max_2m_24h:C/europe:0.05,0.05/html_map

