Getting Started With Meteomatics Weather Visualization Tool MetX
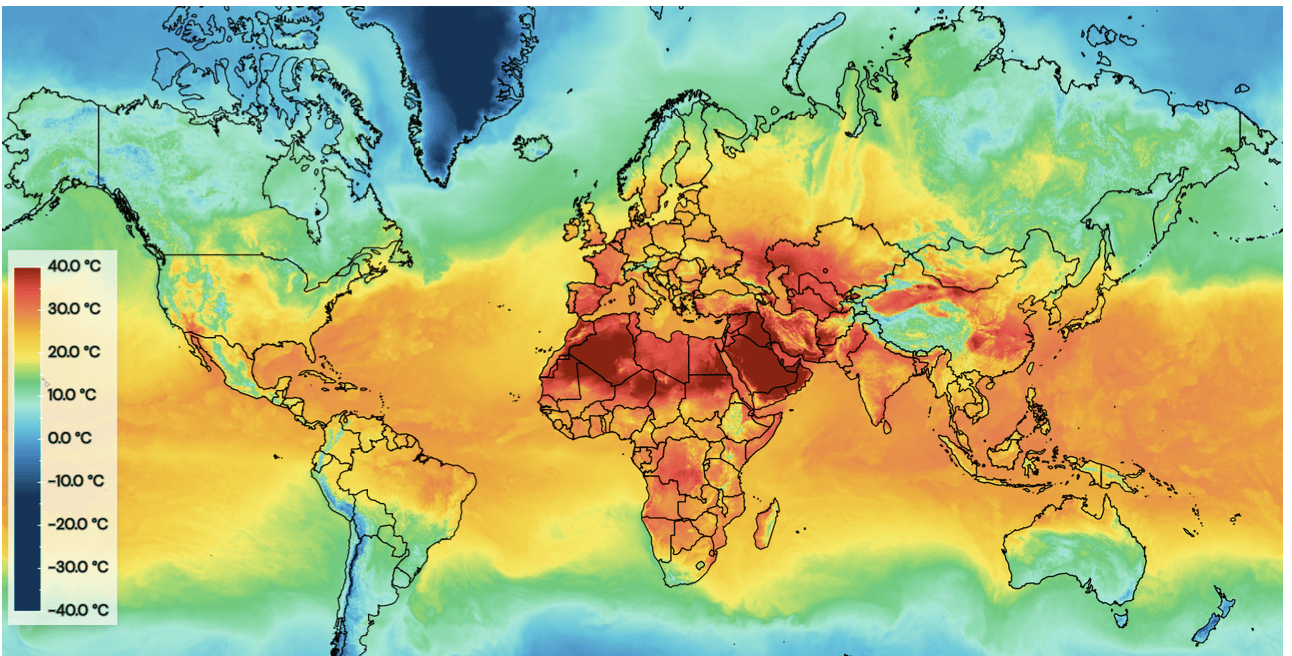
MetX is a web-based weather tool on top of the Weather API developed by Meteomatics. It visualizes all available meteorological and oceanographic API parameters, such as temperature, pressure, humidity, and cloud cover.

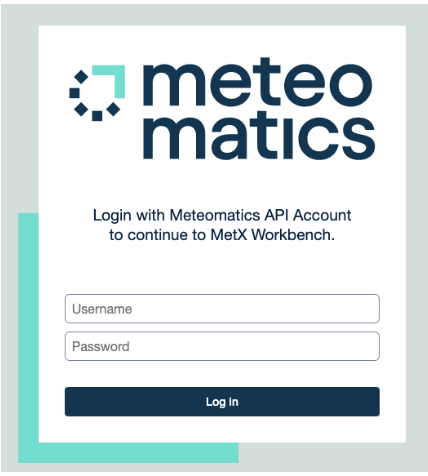
Login
The MetX URL is https://metx.meteomatics.com/. When you first visit this page, you will be asked for your login credentials, which should have been provided by your representative Sales agent. If the login fails, please report to [email protected].

First Navigation
After a successful login, you will be forwarded to the Welcome screen of MetX. On the Welcome screen, four default dashboards are already present within the ”Your Dashboards” section.


A dashboard is a collection of tabs which can contain maps, plots, tables or other features.
On the top right of the grey-shaded dashboard section, the "Filter" field can be used to search for dashboards. This feature is helpful for users with many different dashboards.
Next to the Filter field, dashboards can be sorted by title, creation date, and title date.
Clicking on ”Create Dashboard” creates a new, blank dashboard.


Just enter a name, click on the ”Apply” button and the new dashboard opens automatically. The default dashboard view shows a basic map with no weather layers on top.
By pressing and holding the left mouse button you can change the map extent. Scrolling in and out controls the level of zoom.


The "plus"-sign next to the tab will open a new tab, which can also be renamed. When you open a new tab two things happen:
1. ”x” signs appear which enables you to close a tab. A confirmation message appears, where you can either ”cancel” or ”confirm” to delete the current tab.
2. You are forwarded to the new tab created where you can choose between ”Add Map”, ”Add Plot”, ”Add Table”, ”AddEnergy Plot”, "Add Tephigram", "Add Country Forecast" and "Add Notes. These options are described in more detail in the following sections.


When accessing the top right of a tab, several buttons appear. Their functionality is briefly described below. Detailed examples (where applicable) are linked in the description.
Button description


- "Undo"/"Redo": Reverts the last changes.
- "Layers": Opens the ”Layer Stack”, which enables the user to add Weather layers or maps.
- "Tab Settings": Opens the ”General Tab Settings”, where the user can change the ”Tab Layout”. Up to 6 different maps/plots can be combined in one window. Also the map synchronization can be switched on and off here.
- "Import / Export”: Enables the user to download (=export) or import a Weather dashboards (in a JSON format) as well as export Images and Videos.
- "Location”: Enables the user to look for a specific address or latitude / longitude.
- "Account”: Opens a window where the user is able to sign out and to change the display language from English to German or French.
- "Hide/Show Interface" Enables the user to hide or show these buttons.