Meteogram
With the meteogram you can get an overview over multiple weather parameters and their forecast for a certain location.
Either with a right klick on a location on a map or as a completely new source, you can display a meteogram in MetX.
Add Meteogram as a new source
To add the meteogram in a new MetX window, you simply need to chose the meteogram option in the plot source.

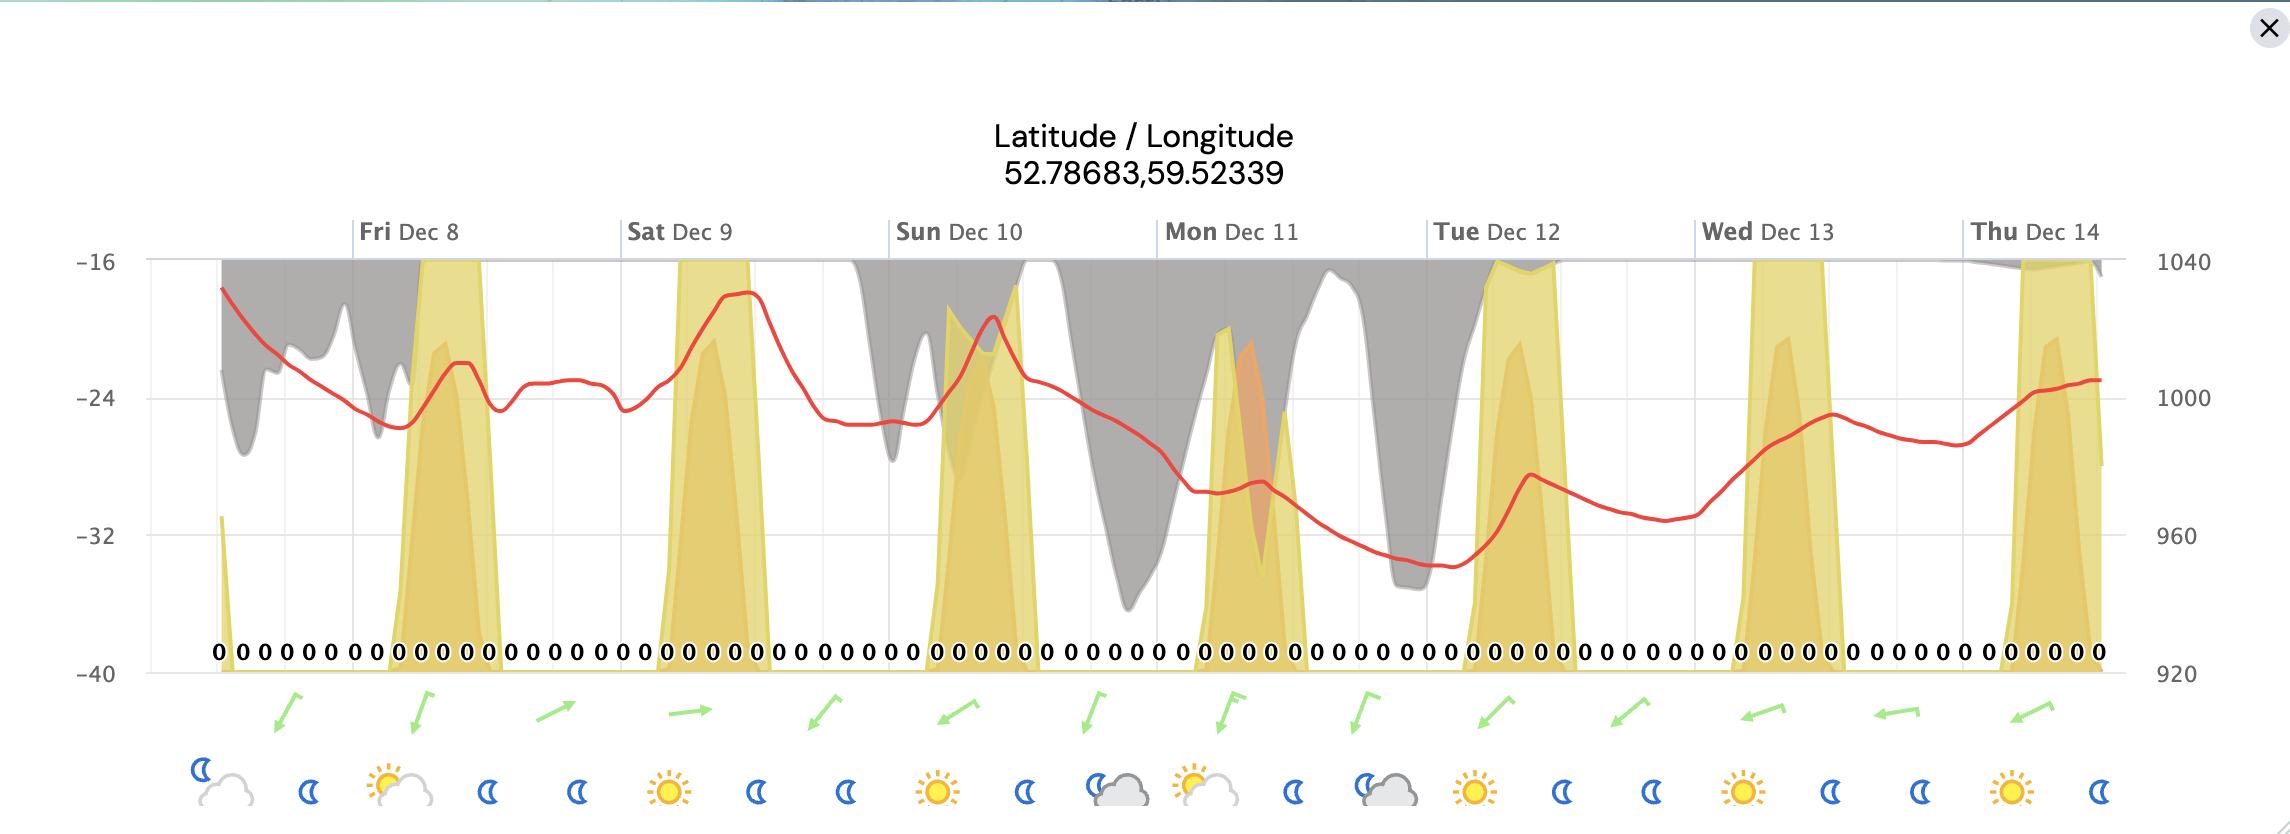
After clicking on it, the meteogram with its default settings appears as the following:

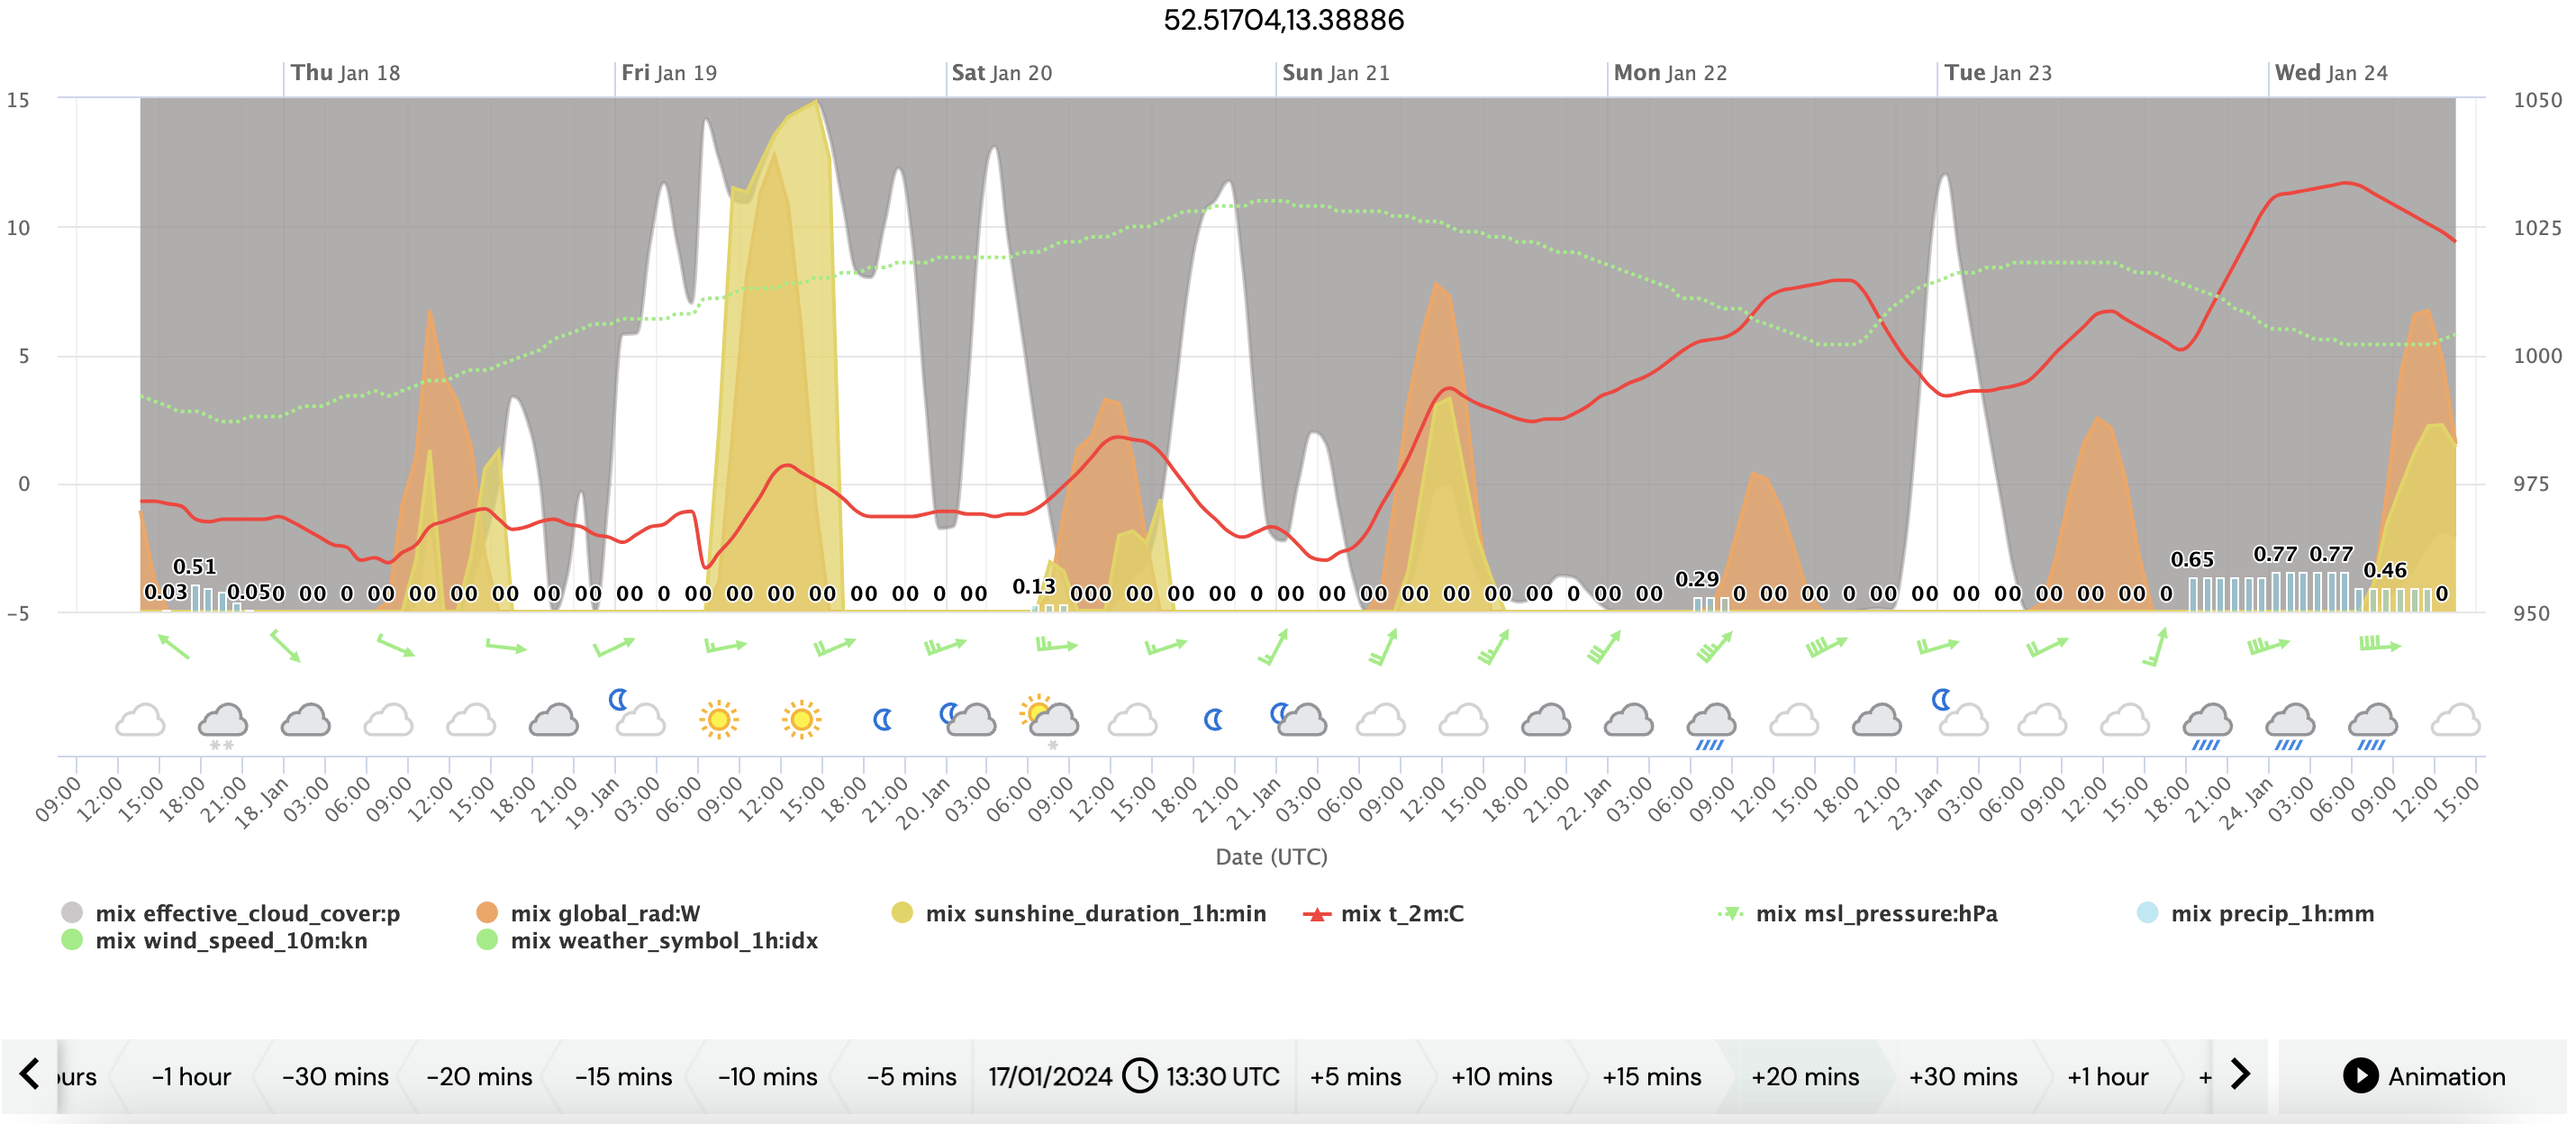

In the meteograms the effecitve cloud cover, global radiation, sunshine duration as well as tempreature, mean sea level pressure, precipitation, wind speed and the weather symbols are show.
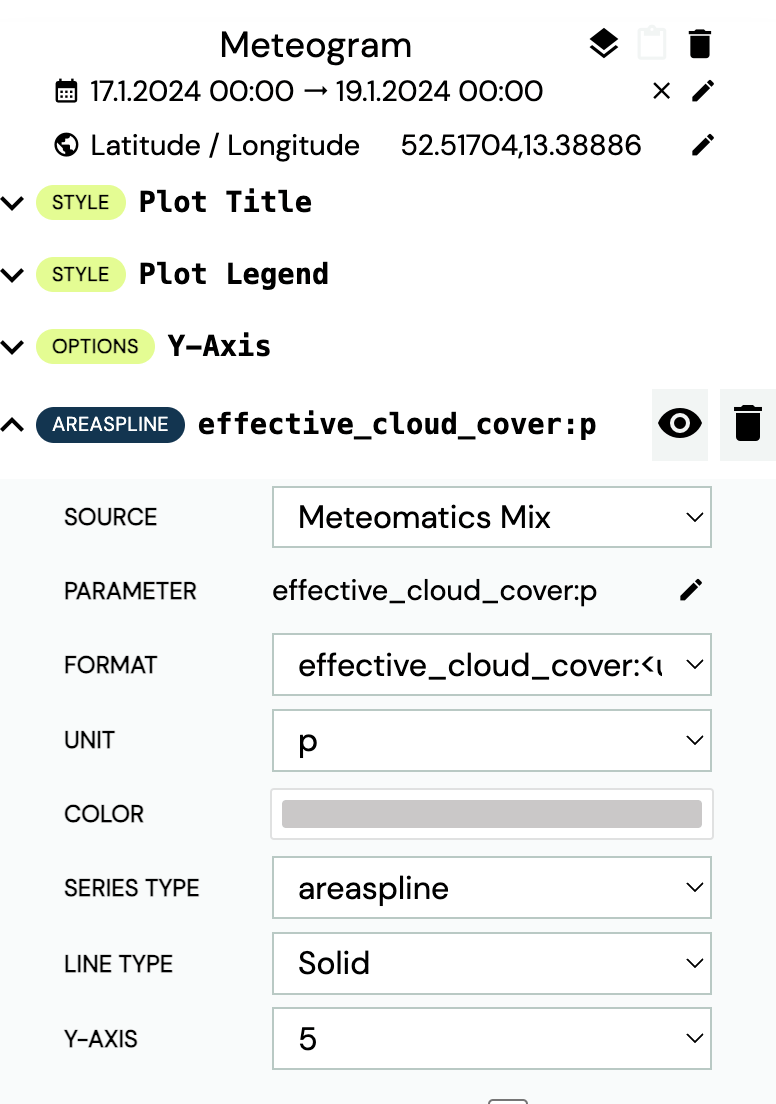
The location as well as the date and time range of the displayed paramters can be changed in the layerstack. You also can find there the option to delete, add or change the configuration of the displayed parameters:

Meteogram as popup
To display a meteogram on top of an already existing map, just use the right click and chose the meteogram as option:

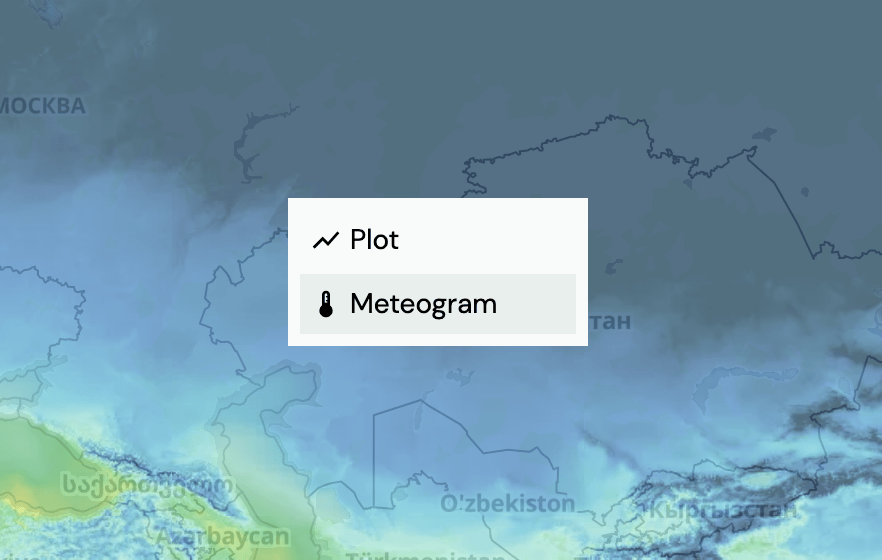

After chosing it the meteogram will be displayed on top of the map:


You have the option to move it around or resize it when dragging the bottom right corner.