Station Data
MetX allows weather station data to be visualized on a map. To add station data to your map, click ”Add Layer” and select ”Station Data” as layer mode in the Layer Stack section.

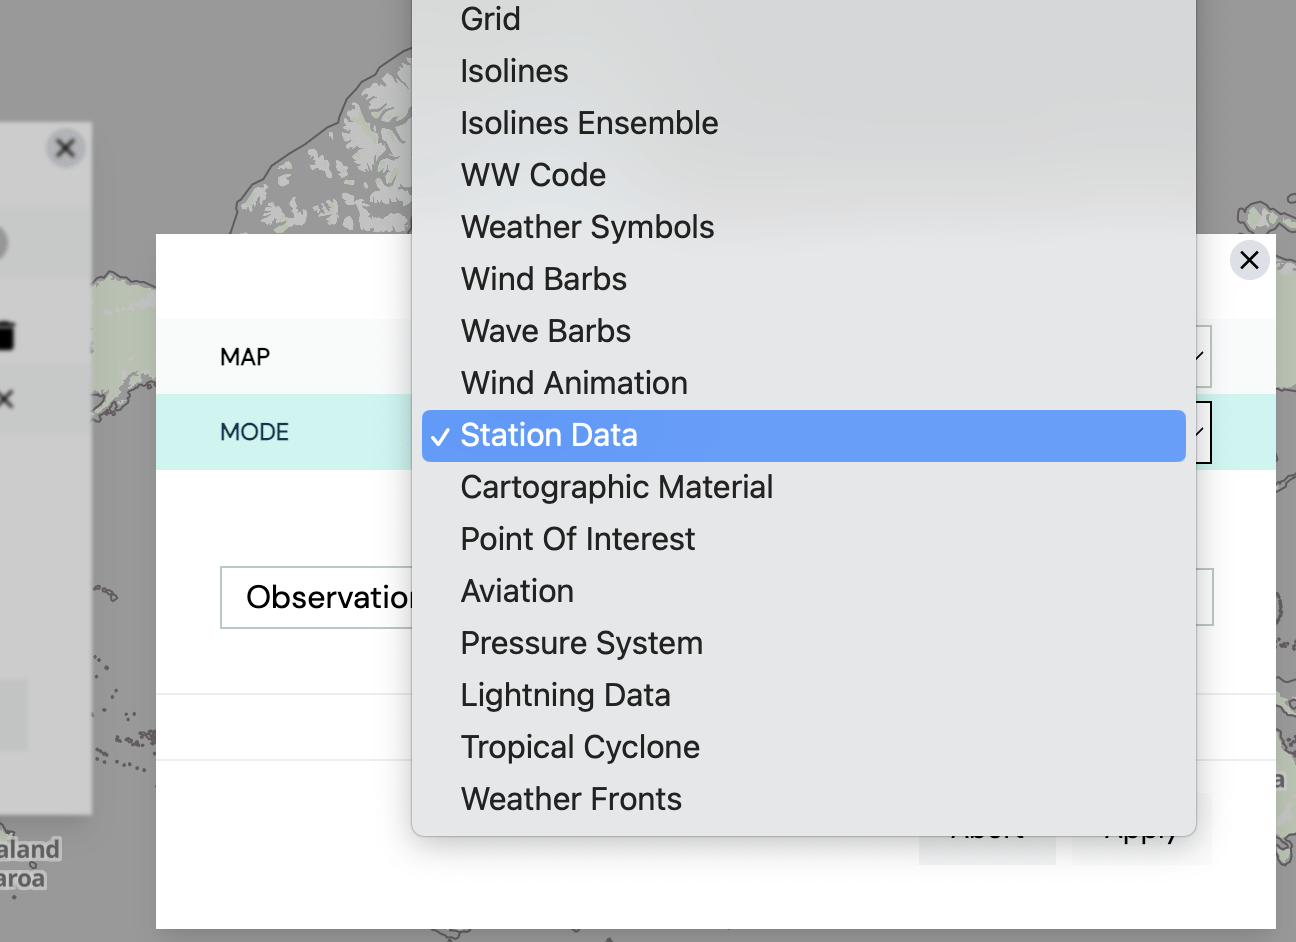
Two fields appear before finally adding the layer. First, you can choose between ”Observations” and ”MOS forecasts”. If both are desired, simply add a second layer of station data and select the preferred source. The other blank field is dedicated to the required parameter. In the blank field, type ”t” to get parameter suggestions regarding the ”temperature” (also compare Fig. 3). Select the first choice and adjust the ”Level” to ”2m”.


Click on ”Apply” to add the 2m temperature station observations to your map. In the Layer Stack the new layer is added and the source, text size and opacity can be modified.

